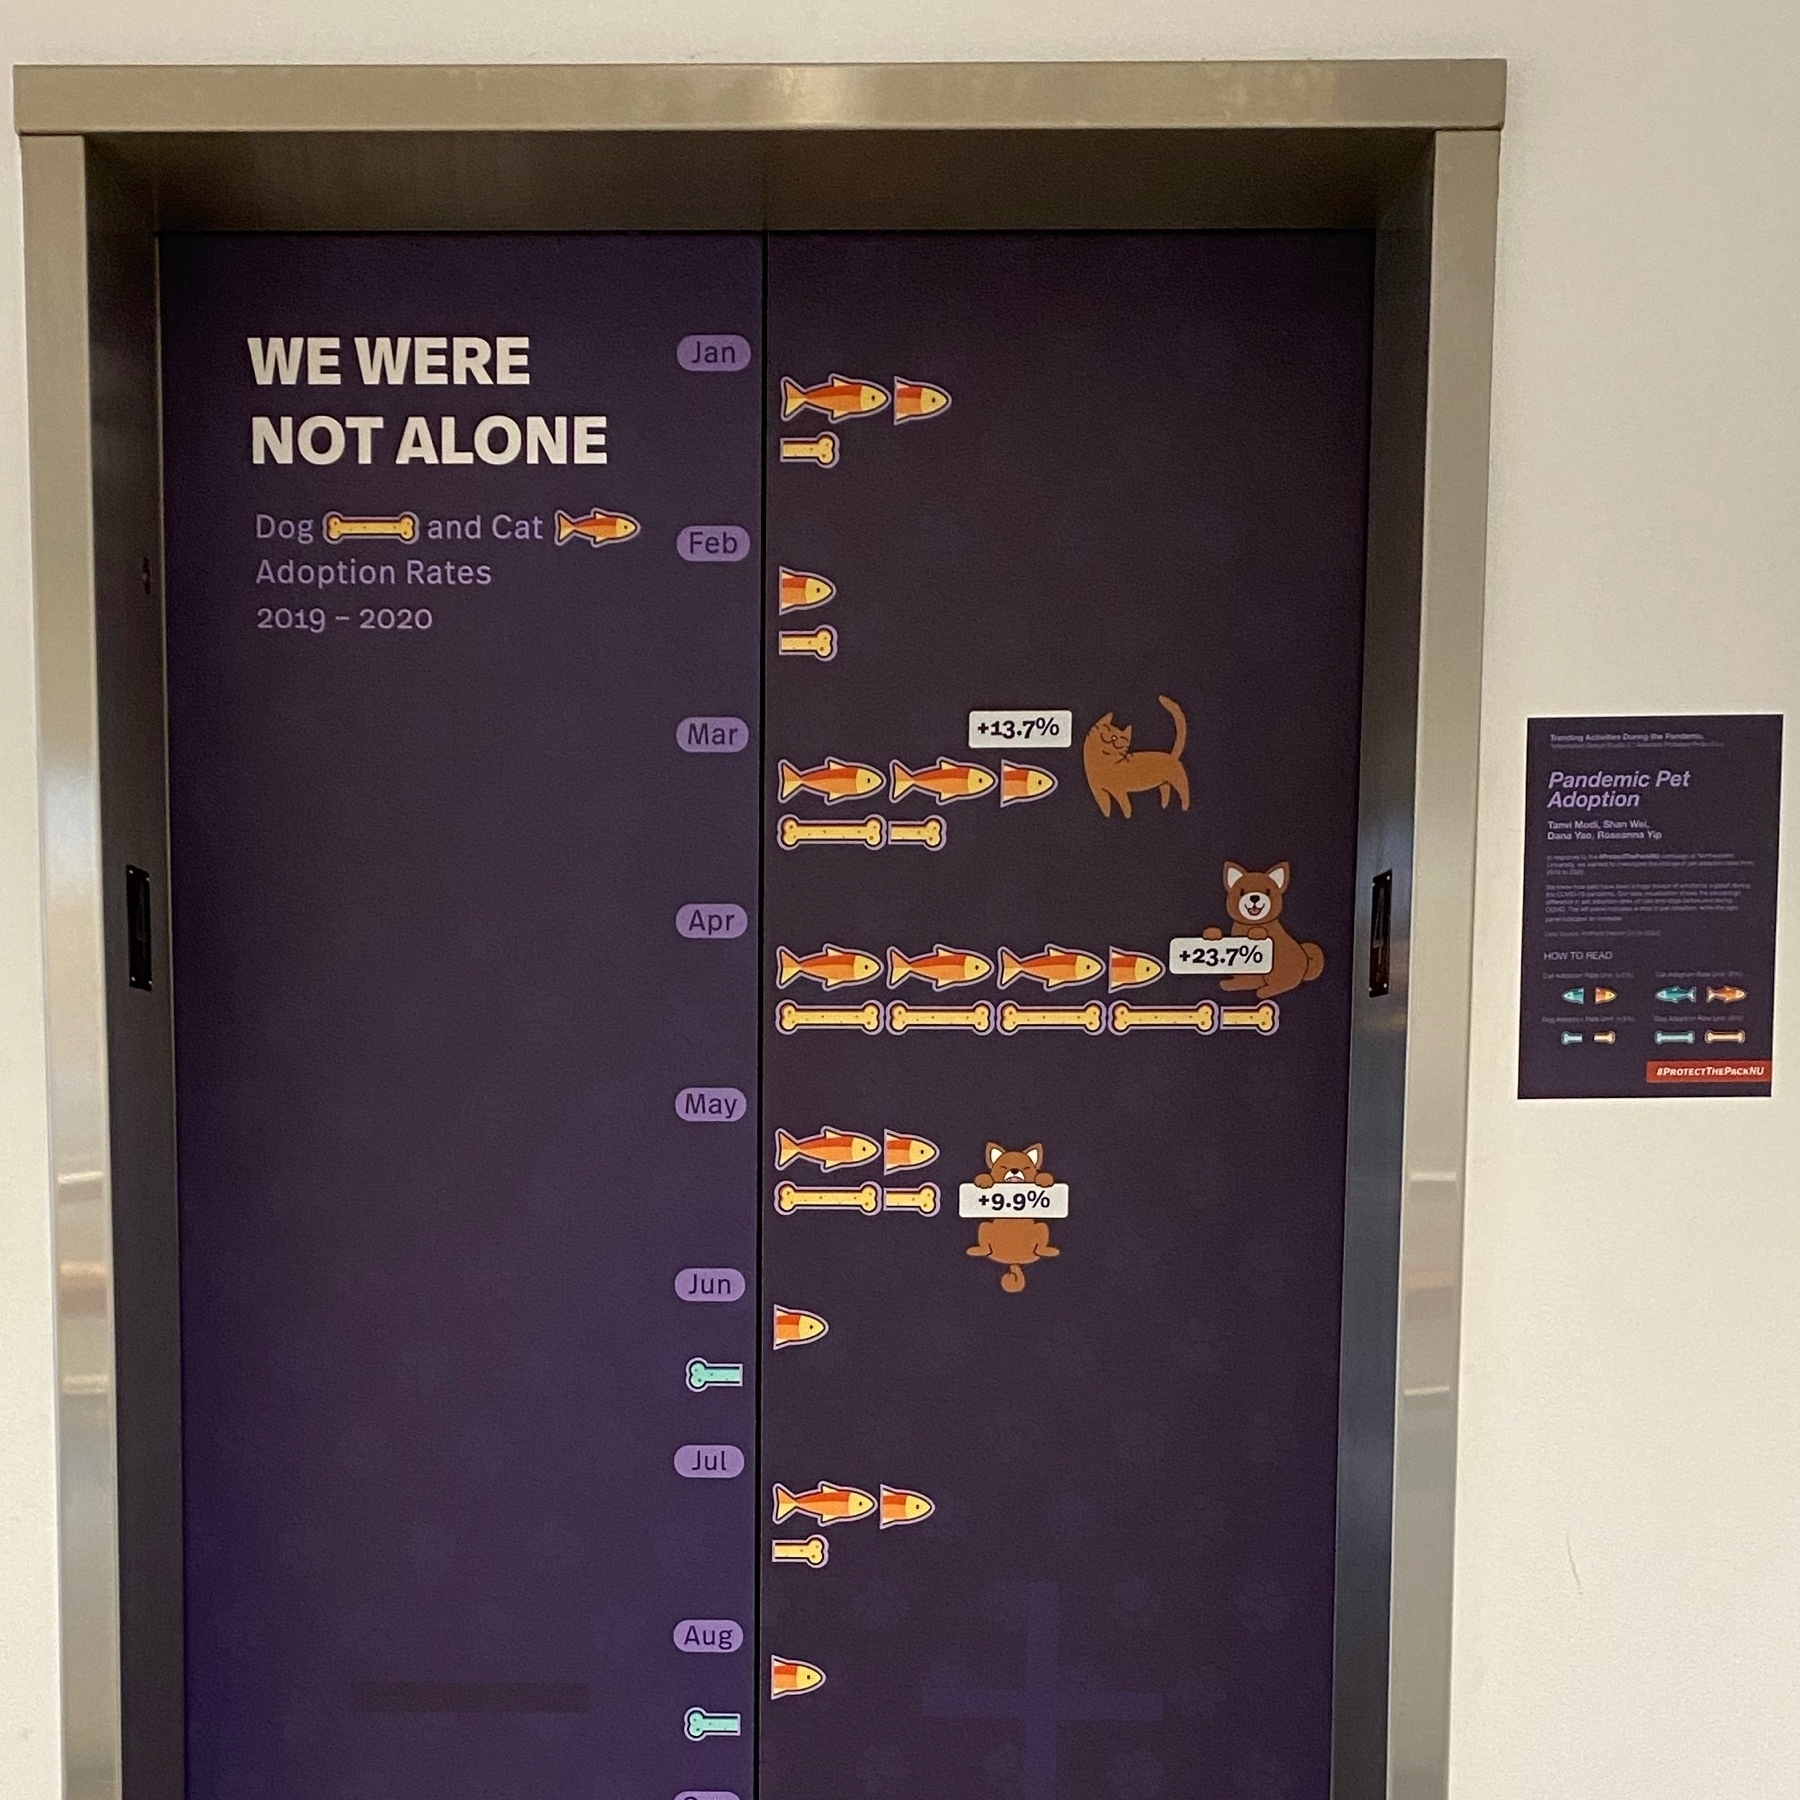
I like the new graphics we have up in our library showing visualizations of how our lives have changed over the last year. (These are by @Northeastern students studying data viz.)
I like the new graphics we have up in our library showing visualizations of how our lives have changed over the last year. (These are by @Northeastern students studying data viz.)